


On this page
Temperature mapping uses multiple recorded measurements to find how conditions vary across a frozen-food store and over time. Place suitable calibrated loggers at documented positions through the storage volume, study the load and operating conditions that matter, and connect the results to door openings, defrost and other events. One controller probe cannot describe every rack tier or remote corner.
The useful outcome is a justified storage and monitoring decision: where routine sensors should go, which positions need investigation, which operating conditions the study covered, and what changes require another assessment. A map of air temperatures is not automatically a temperature history for every carton or proof of product safety.
Start with the frozen product requirement and the warehouse question. Then design the study with the operator and responsible quality personnel. Avoid copying a pharmaceutical protocol, a fixed logger grid or a universal study duration into a food store without checking its purpose and applicability.
Map the storage volume that actually holds food
A cold-store display reports its own sensing location. Temperature mapping asks a wider question: how does the occupied storage space behave under the conditions being assessed? The distinction matters where tall racks, remote bays, changing loads or repeated door traffic create environments that the controller does not directly observe.
Testo Industrial Services’ mapping description [1] covers climate-distribution studies of warehouses, cold rooms and freezers, including identification of critical monitoring positions. Its qualification service focuses on pharmaceutical and medical-technology requirements. The measurement concept helps frame questions, but does not impose GxP obligations, a sensor count or a study duration on every frozen-food store.
Define the included storage volume on a layout. Show the rack bays, levels, usable positions, doorways and refrigeration equipment. If a staging area or an adjacent chamber is outside the study, say so. A report for one room should not be described as qualification of the entire distribution site.
Include vertical position in every location description. “Rack B” may encompass several environments. A lower pallet near an access aisle and the highest pallet under a ceiling can occupy different positions even though both have the same rack letter. Coordinates or a clear rack-level convention help another person reproduce the location.
Use the layout to distinguish an unmapped position from a measured position with an unfavourable result. The first lacks evidence; the second has evidence requiring action. Calling both a hot spot hides that distinction. Reserve “hot spot” for the warmer location or pattern actually identified under the study’s defined conditions.
Define the product requirement and decision before placing loggers
Write what the study must decide. Examples include whether a proposed storage arrangement meets the agreed conditions, where routine air monitors should be positioned, or whether a changed rack layout has introduced a location requiring investigation. These questions may share measurements, but their acceptance evidence is not necessarily identical.

Mango cheeks illustrate one stock form. The photograph does not establish storage history, product temperature or a warehouse qualification result.
The Codex quick-frozen-food code [2] describes storage designed to maintain product at −18°C or colder with minimal fluctuation and adequate circulation. Keep that general product-temperature basis distinct from a warehouse controller set point, air-study criterion and any applicable destination or contractual requirement. Do not convert one displayed air number into an assertion about every stored product.
Document the product scope, packaging and storage arrangement. A room containing bulk fruit cartons is not described fully by “frozen food.” Identify the forms, pack sizes, pallet configurations and permitted rack positions relevant to the study. The photograph here shows mango form, not a measured temperature or a qualified storage route.
Agree how results will be assessed before collecting them. Specify the measurement target, required instrument performance, criteria, event coverage and responsibility for reviewing deviations. If product measurements are required as well as air mapping, define a separate suitable procedure. Do not silently assume that loggers attached to a rack measure the food inside a carton.
Separate the study decision from the product-disposition decision. An air excursion can trigger investigation, but its appearance alone does not settle whether a specific lot is acceptable. The responsible quality team needs the product requirements, exposure evidence and appropriate assessment. The mapping report should preserve enough context for that review.
Plan the positions in three dimensions
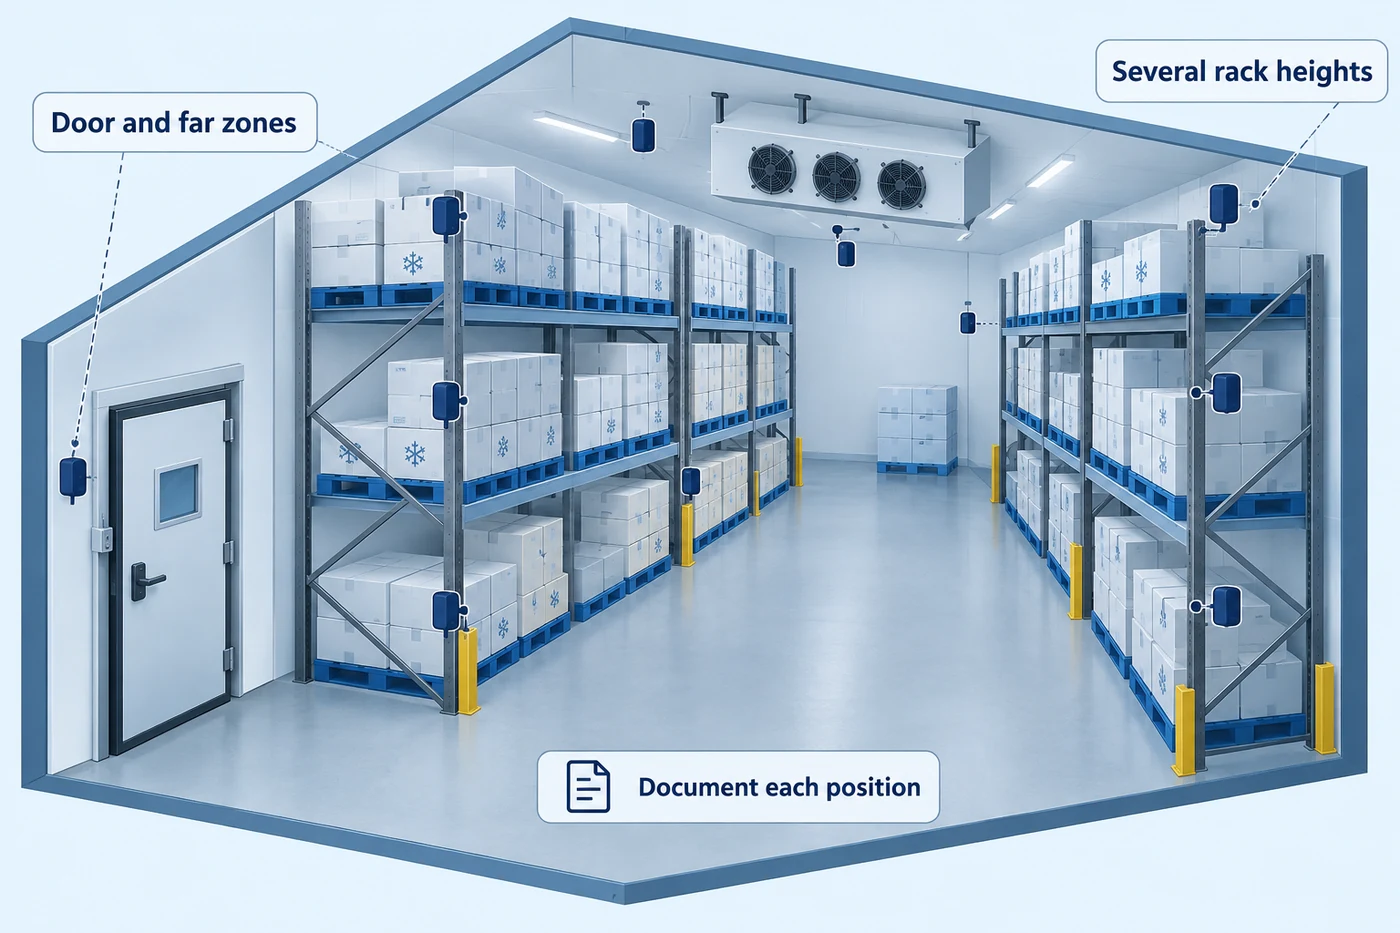
Build the placement plan from the actual room and question. Cover relevant occupied heights and horizontal zones, then add locations justified by potential risks or earlier observations. Doors, far bays, areas influenced by equipment and positions around restricted circulation are candidates to investigate, not preassigned universal hot spots.
The diagram scrolls horizontally on smaller screens.
Conceptual sensor positions span rack heights and suspect zones. The illustrated number and spacing are examples, not a prescribed study design or measured temperature map.
For each node, record an ID and location another person can find. Use the room, rack, bay, level and sensing-element position, with a photograph where useful. A logger body hung on a rack may have an external probe elsewhere; describe the probe location when that is what measures temperature.
Distinguish routine control sensors from independent mapping instruments on the layout. The controller channel can be retained as additional context, but should not be mistaken for an independent reading at an unmeasured bay. If both are compared, retain their identities, locations and time bases.
A placement plan should also explain its gaps. An inaccessible upper tier, a logger lost during movement or a section excluded because construction was unfinished remains a limit on the evidence. Identify whether additional measurements are needed before making the intended storage decision.
A primary study by Akdemir and Arin [3] found nonuniform temperature and airflow in an experimental chilled store at 0–3°C. It supports the need to examine multiple locations, but its numerical conditions are not frozen-store acceptance criteria. Your room requires its own defined observations.
Do not use a diagram’s number of sensor dots as a prescription. The schematic demonstrates several heights and zones. The actual count needs to follow the space, risk, coverage and study objective, with the operator and quality personnel able to explain why the chosen arrangement answers the question.
Compare empty, loaded and operating conditions
Describe the conditions represented by each run. An empty room can help examine the equipment and enclosure before stock is placed, while a loaded run addresses a different physical arrangement. Whether both are required depends on the study purpose. If a report covers only one condition, state that coverage plainly.

The diagram scrolls horizontally on smaller screens.
Conceptual empty and loaded conditions keep the room geometry comparable. Describe the actual load and operating events; arrows do not predict a numerical airflow or temperature result.
Keep the location convention consistent between comparable runs wherever practicable. If a logger position moves because a pallet occupies it, document the change. Otherwise, an apparent difference attributed to loading may also contain an unreported change in measurement position.

Sweetcorn kernels illustrate a different stock form. Document actual product, packing and load occupancy; the image cannot predict their thermal response.
For a loaded run, record what “loaded” means. Include the occupied bays and levels, pack and pallet arrangement, relevant clearances and the condition of incoming stock. A few pallets in the centre of a room do not necessarily represent its intended normal or maximum operating arrangement.
Choose operating-event coverage according to the question. Regular access traffic, defrost cycles and the period after replenishment may be important. An overnight interval with no activity can describe that interval accurately while leaving the busy receiving period unassessed. The report should not generalise beyond what the run actually captured.
FAO’s cold-store engineering discussion [4] explains that circulation, stacking, door ingress and frost or defrost affect storage conditions. Its fish-specific temperatures and storage-life tables should not be imported into a frozen-fruit or vegetable study. Use the physical mechanisms to identify questions for your site.
Do not deliberately create an uncontrolled food exposure to obtain a dramatic graph. Planned challenges or abnormal-condition assessments need an approved scope, safeguards and responsible operators. If an actual fault occurs during a study, protect the product under the applicable procedure and preserve the event record for review.
Keep clocks, calibration and events connected
Check instruments before the run. The chosen device and sensing element need a range and measurement performance suitable for the intended freezer conditions. Review the relevant calibration information and its applicability to the measurement task; a certificate for an unrelated point or a different probe does not resolve the entire question.
Use a common time basis and document any offsets. Keep the recording interval and configuration with each native file. An apparent early response at one position may be a clock difference if the devices were not aligned. Correct comparisons transparently while preserving the original files and settings.
Record events with enough detail to connect them to the traces. “Door open” should identify which door and the documented start and end where available. A defrost event should refer to the affected equipment and time. Distinguish an event occurring from somebody entering a note afterward.
Confirm the data path too. A temporary loss of a wireless display may concern transmission while measurements remain stored in the logger, or it may represent missing measurements. Find out which applies. Do not fill a blank section of the chart with an assumed temperature or label it a refrigeration failure without evidence.
Retain the native readings, configuration, location plan and event log together. A presentation chart can make patterns easier to see, but should remain traceable to those records. If readings are averaged or resampled for display, identify that treatment and retain the individual values needed for review.
Our guide to thermometer calibration and routine checks explains the different roles of those activities. Use the distinction to ask for evidence appropriate to the instrument and study rather than requesting a generic calibration label.
Read patterns without averaging away the problem
Review each location before producing a whole-room summary. Compare the periods, maxima, minima, durations and recoveries relevant to the agreed criteria. A room average can conceal one position that behaves differently, and cannot describe a position where no logger was placed.
Then examine spatial relationships. Did several sensors near the same doorway change together? Did an upper-tier position differ during a particular event? Was one channel unlike its neighbours throughout the run? These questions help direct investigation, but should remain observations until the location and instrument records support a cause.
Separate a recurring warmer location from a short, event-linked rise. Both can matter, but may need different actions. A pattern associated with regular door traffic might require reviewing storage use near the entrance; a persistent difference elsewhere might require equipment or circulation assessment by the operator. The map identifies where to investigate rather than diagnosing every mechanism automatically.
| Observed pattern | Evidence to connect | Decision it can inform |
|---|---|---|
| One channel differs throughout | Placement, calibration and neighbouring records | Instrument or local-condition investigation |
| Several door-zone channels rise together | Door identity, event times and recovery | Access practice and nearby storage review |
| Difference appears only in loaded run | Comparable positions and documented load | Load arrangement and circulation review |
| Graph contains a blank interval | Native device file and transmission history | Data recovery or coverage limit |
| Air criterion is exceeded | Duration, coverage and product assessment needs | Quality review under the applicable procedure |
Consider a hypothetical report in which the room average meets its study criterion but a door-adjacent upper rack has repeated excursions during receiving. The average does not erase that position. The reviewer should check event alignment, measurement validity and the storage requirement, then decide whether the position can remain in use, needs another control or requires further evidence.
Do not turn a coloured interpolation into a measured fact between sensors. A heatmap may illustrate the available readings using a modelling choice, but its smooth colour field does not add observations. Identify the mapped nodes and the display method so unmeasured locations remain recognisable.
Turn the map into monitoring and storage actions
Choose routine monitoring positions from the actual findings and the purpose of the ongoing system. A control probe, a monitor intended to detect a vulnerable storage condition and a temporary mapping node can have different jobs. Keep those jobs visible in the final location list.

The diagram scrolls horizontally on smaller screens.
Hypothetical investigation links a mapped pattern to monitoring and a storage action. The marked zone is illustrative, not a universal warehouse hot spot or a real XMG facility finding.
Sensitech’s stationary-monitoring guidance [5] separates monitoring and alerts from thermal mapping used to identify risk areas. A permanent sensor does not reproduce the entire survey. Its position should have a documented rationale, and its alarms need a defined response by the responsible operation.
Where the study raises a storage concern, define the actual corrective decision. Options may include investigating circulation, reviewing rack use, changing access practices or restricting a location until appropriate reassessment. Select the action through the site’s responsible process; do not recommend moving refrigeration equipment from a generic diagram.
Write the resulting storage conditions so warehouse staff can apply them. Identify permitted positions, any restrictions, the relevant monitoring points and what to do if the load or operating pattern changes. A report stored in QA’s folder has limited practical value if the replenishment team cannot identify the affected rack.
Also test the communication path for an alarm. Name who receives it, who checks the condition and who controls stock decisions. Technical transmission to a dashboard is separate from an actionable operational response. A useful mapping result should help connect these responsibilities, while avoiding a claim that alarms prevent every exposure.
Retain the evidence for reassessment. If a rack position is restricted, identify why and what evidence would allow its use to be reconsidered. This avoids the opposite errors of a temporary restriction becoming permanent without review or disappearing informally during a busy receiving shift.
Decide when a change needs another study
Review changes that could affect the conclusions: rack geometry, occupied height, product or pack arrangement, refrigeration equipment, door use, access traffic or the storage volume itself. The old report may remain useful historical evidence while no longer answering the new operation’s question.
There is no universal remapping interval set here. Define periodic review and change triggers under the applicable food, customer and site requirements. An arbitrary calendar date should not replace a review of a major physical change; equally, an unchanged-looking room may have a different operating pattern worth examining.
Seasonal conditions may need consideration where they influence the operation. Describe which external conditions and activity patterns were represented instead of assuming that a single quiet run covers every future period. Decide what additional coverage is justified with the responsible technical and quality personnel.
Vaisala’s mapping service [6] describes documented environmental studies and analysis, primarily in controlled life-science environments. Its measurement and documentation concepts can inform questions; pharmaceutical qualification obligations do not become food-store requirements merely because the same instruments are used.
A clear final report identifies the room and study version, decision, included conditions, instruments, location map, data and event records, findings, gaps and resulting actions. The approval should say what the evidence supports. Avoid the unrestricted phrase “warehouse validated” when the study covered only particular positions and operating conditions.
How we connect the product brief to storage handoff
We supply frozen fruits, vegetables and mushrooms and coordinate product, packing and shipment requirements for the order. Our cold-chain coordination connects the product brief to the responsible facility and logistics parties.
Share the product and pack, receiving arrangement and the temperature information your team requires. We can clarify order-specific product and handoff questions so the warehouse operator works from an identified consignment. Warehouse mapping, equipment control and qualification decisions remain with the responsible operator and quality personnel; we do not present a product specification as a qualification of your storage room.
Send the storage and shipment requirements
Send the frozen product and pack, destination and receiving schedule, and the required temperature and handoff records. We will review the supply brief and coordinate the relevant product and shipment confirmation points with the appropriate parties.
