


On this page
Frozen produce is not automatically lower or higher in carbon footprint than fresh produce. A fair comparison follows the same food function through comparable stages: growing, preparation, preservation, transport, storage, cooking and the amount ultimately eaten. Freezing adds processing and refrigeration, while a longer usable life and different supply arrangements may change waste and other burdens.
The answer depends on the product, origin, season, transport mode, energy supply, storage duration and use. Before comparing two carbon numbers, check their functional unit and system boundary. A kilogram leaving a packing site and a kilogram eaten at home are different comparison bases. Without comparable data, a broad fresh-versus-frozen ranking is more confident than the evidence allows.
A fair comparison needs the same function

Start by describing what the foods are supposed to do. Cooked carrot pieces in a meal, fresh berries used as an intact garnish and fruit purée for a sauce are not interchangeable functions. A preserved ingredient can be a suitable substitute in one application and a poor one in another. An environmental comparison needs to acknowledge that distinction.
For a simple cooking comparison, the function might be “provide 100 g of edible cooked carrots on the plate.” That statement fixes a useful output. It then asks how much material and which operations are needed to produce that output through each supply route. It avoids assuming that every kilogram purchased becomes a kilogram eaten.
A purchasing comparison might instead use one kilogram of an ingredient delivered to a food manufacturer. That can be valid for the defined decision, but it does not include the downstream kitchen or consumer. The reported number should retain that boundary. A factory-delivery result is not a complete field-to-plate result.
Food life-cycle assessments use a functional unit to define the service being compared. The Joint Research Centre publication on food LCA challenges [1] identifies functional units, system boundaries and regional context among important comparability issues. A common unit written as “kg” is insufficient if one study counts purchased mass and the other counts edible mass.
Also establish product equivalence. Peeled diced carrots and untrimmed whole carrots differ in edible yield and preparation. A frozen mix is not a single fresh vegetable. Sweetened fruit and plain fruit differ in recipe as well as preservation. Match the actual products before debating which chain has fewer emissions.
Draw the boundary before counting emissions

A system boundary identifies which operations belong inside the calculation. Both routes may include cultivation, harvesting, sorting, packaging, transport, storage, preparation and waste treatment. The preserved route may include blanching where used, freezing and frozen storage. The fresh route may include cooling, refrigerated transport and retail refrigeration. The actual operations depend on the product and route.
The public descriptions of ISO 14040 and ISO 14044 describe life-cycle assessment through goal and scope, inventory, impact assessment and interpretation, alongside reporting and review. The useful lesson for reading a comparison is that its goal and assumptions are part of the result. A carbon number detached from them is difficult to judge.
Make a two-column process map. Include the actual fresh and frozen stages and mark any excluded stage. If one calculation stops at retail, stop both there or make the difference explicit. If one includes cooking, include a justified cooking scenario for the other rather than borrowing a result with a shorter boundary.
Packaging deserves the same treatment. Count the relevant material and disposal assumptions in both routes. A visibly thicker bag does not prove a larger complete footprint than a tray or carton, and a recyclable label does not establish the actual end-of-life scenario. Packaging can also affect damage and loss; that relationship needs evidence rather than a convenient credit.
A photograph of a freezer shows equipment, not its emissions. You need electricity use, the time and amount of food served by that use, a suitable electricity factor, and the other relevant sources. Similarly, a transport distance is not an emission total until mode, load and appropriate calculation factors are established.
Keep carbon footprint separate from a complete environmental judgment. A study may measure greenhouse gases expressed as carbon dioxide equivalents. That does not automatically settle water use, land use, eutrophication or other impact categories. If the decision also concerns those effects, read them separately rather than treating one carbon ranking as a universal sustainability score.
Growing season, transport and refrigeration can change the result
Fresh produce can follow very different routes. Seasonal outdoor production supplied nearby is a different scenario from heated protected cultivation or air-freighted supply. Frozen produce also varies by growing region, processing operations, transport and energy supply. Preservation format alone leaves much of that variation unexplained.
A published study of vegetable consumption in the UK [2] highlights the influence of factors including transport mode, seasonality and downstream stages. Its setting and product coverage belong beside its conclusions. It cannot be converted into a universal ranking for every vegetable imported from China or every household meal.
Distance is worth recording, but mode matters too. A long sea movement and a shorter air movement have different emission characteristics. Road distribution, load utilisation and temperature control can add further differences. “Local” and “imported” are incomplete descriptions for a carbon calculation because neither identifies the full transport activity.
For cold storage, duration and energy supply both matter. A short stay in one facility and months in another are not the same operation. Electricity intensity can vary by geography and time, and equipment performance can vary by installation and loading. Use evidence appropriate to the scenario rather than a generic freezer factor selected because it makes the desired route look better.
Refrigerant leakage is another possible source of greenhouse-gas emissions. The UNEP and FAO report on sustainable food cold chains [3] discusses the relationship between refrigeration’s environmental burdens and its role in reducing food loss. Accounting should consider both, with stated assumptions; cooling is neither free of impacts nor automatically an unnecessary burden.
A change in electricity supply does not erase every other stage. Even a low-emission electricity scenario can leave cultivation, packaging, transport, refrigerants and waste relevant. Likewise, the presence of freezing does not prove that the total chain must be worse. The question remains the sum of the included activities per defined useful output.
Bring edible yield and waste into the denominator

Food losses affect the amount of production and handling required for a given eaten output. If part of the purchased food is discarded, the useful edible portion carries the burdens associated with more input material. Disposal can add its own effects. To compare this fairly, distinguish inedible trimming from avoidable waste and identify the stage at which each occurs.
Consider a deliberately hypothetical mass example. Route A needs 125 kg of purchased product to supply 100 kg eaten, corresponding to an 80% edible yield. Route B needs approximately 111.1 kg for the same output at a 90% yield. These invented yields illustrate denominator arithmetic. They do not say that fresh or frozen produce has either yield.
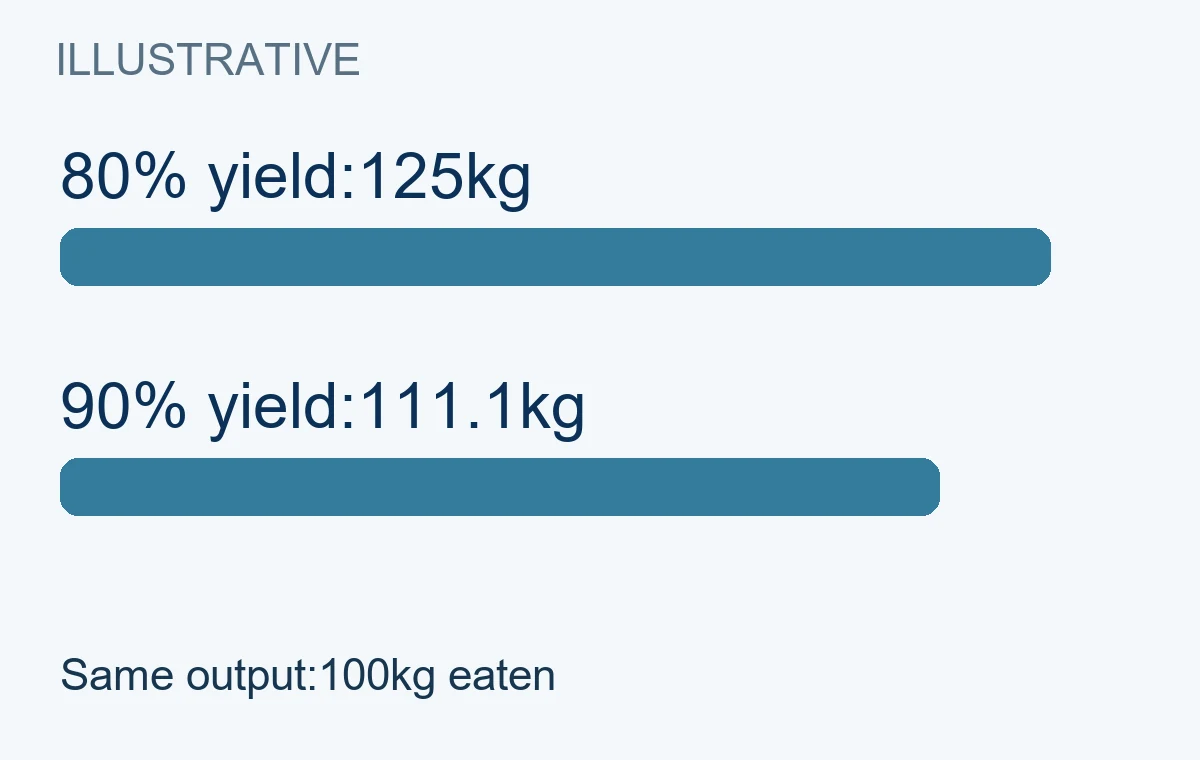
The higher-yield route uses less purchased input for this defined output. That does not by itself prove it has the lower carbon footprint. Its emissions per kilogram of input may be higher, and the full balance also depends on where the loss happens and which operations have already been incurred.
An early sorting rejection has a different inventory history from a cooked portion discarded after serving. The latter has already passed through downstream transport, storage and cooking. A single undifferentiated waste percentage can obscure that distinction. Where the data allow, model losses at the actual stages.
Portion flexibility can influence household or food-service waste. A frozen ingredient that can be portioned as needed may help in a particular use, but the benefit depends on actual handling. If a bag is poorly stored or an oversized portion is prepared and discarded, the assumed reduction may not occur. A longer storage life is an opportunity, not measured avoided waste by itself.
Fresh produce can also have very low waste when the quantity, demand and storage are well matched. Do not assign a high fresh-food waste rate simply to produce a favourable comparison. Use measured waste for the defined operation, or present a range of clearly labelled scenarios when measured data are unavailable.
Be careful with credits. If a model gives a route credit for avoided food production, check whether that follows consistently from its functional unit and accounting method. Do not both reduce the input quantity for improved yield and add another unsupported credit for the same saved food. Double counting can make a plausible waste argument numerically wrong.
Keep cooking and household storage in the same scenario
A field-to-plate comparison needs a stated preparation. Fresh and frozen carrots may have different heating requirements or preparation steps, but those differences depend on the product and method. Blanched frozen pieces should not be compared with an unrelated fresh recipe and then treated as equivalent meals.
Record the appliance, portion or batch size, preparation time and intended endpoint. Cooking energy allocated to a single portion can differ when several portions share a pan or oven. A continuously heated commercial appliance requires an allocation basis. A stated cooking time alone is not enough to calculate energy use.
If a dish is held hot, chilled and reheated, include those stages where they belong within the boundary. A freshly cooked comparison does not describe a service system with several additional operations. The same principle applies to washing, peeling and trimming: account for the relevant activities and their yields consistently.
Household freezer allocation can be particularly uncertain. The total appliance electricity serves many foods and a period of storage. Decide how that use is allocated, and show the sensitivity to storage duration or the allocation method where it matters. Do not assign the entire freezer’s annual electricity to one bag or treat storage as zero simply because the appliance already exists.
The fresh route may also need home refrigeration. Include it when the chosen boundary includes household storage. A comparison that counts a long frozen-storage period but omits the fresh product’s refrigeration describes unequal assumptions. That can be appropriate only if the actual intended scenarios are unequal and the difference is stated.
Food safety constrains the comparison. Reducing required cooking or abandoning suitable storage to lower an environmental estimate is not a valid equivalent-use scenario. Model the foods as they are responsibly handled and used. An unsafe shortcut does not provide the same function as a safe edible meal.
Read a published comparison without borrowing its result

Read the product list first. A study of vegetables does not automatically cover berries, mushrooms or a mixed dish. Even within a group, growing practices, edible parts and preservation operations differ. A result for one carrot route is evidence for that case, not a label for every frozen ingredient.
Next identify geography and the data period. Electricity, cultivation and transport assumptions can change across places and years. An old study may still offer a useful method, but its factors should not be presented as current measurements of another supply chain. State when you are discussing the method rather than transferring the numerical result.
Check the functional unit, boundary and included impacts before looking at the headline ranking. Then examine how storage, cooking, packaging, yield and waste were modelled. Ask whether both routes received equivalent treatment and whether the assumptions describe the decision you are making.
Look for uncertainty and sensitivity analysis. If a ranking reverses with storage duration, transport mode or waste assumptions, the reversal is part of the useful conclusion. A single central estimate can conceal a decision that depends heavily on local conditions. Where ranges overlap or the inventory is weak, avoid a precise winner.
A supplier report can provide relevant primary information about its own products and model. It should still be assessed for scope, data quality and review. It cannot establish another supplier’s footprint. A third-party paper also requires scrutiny; publication does not make incompatible functional units comparable.
Marketing phrases such as “lower carbon” need a clearly stated comparator and support. A comparison with one high-impact scenario should not be broadened to all fresh alternatives. If a claim is meant for public use, establish the applicable reporting and claim requirements rather than assuming that a privately assembled spreadsheet is sufficient.
Build a transparent comparison for one supply route
Begin with a named product and use. Specify the destination, season, prepared output and decision boundary. For example, the comparison could concern diced carrots delivered to a kitchen and cooked for a set menu. This is concrete enough to identify missing information without pretending to describe every produce market.
Gather activity data for each included stage. Identify cultivation and processing evidence, packaging quantities, transport mode and distance, relevant storage duration and energy, edible yield, and preparation. Note which values are measured, calculated, drawn from databases or assumed. Keep the source and data period attached to each input.
Apply consistent emission factors and allocation methods. Electricity use in kilowatt-hours is not a carbon footprint until the appropriate factor is applied. Kilograms of food lost are not equivalent to kilograms of carbon dioxide emissions. Keep units visible throughout the calculation to prevent unlike quantities being added together.
| Comparison element | What to establish | What a weak shortcut misses |
|---|---|---|
| Useful output | Same edible food function and amount | Purchased kilograms may have different yield |
| Processing and storage | Actual operations, duration and energy basis | A freezer photograph supplies no energy data |
| Transport | Mode, route, load and temperature control | Distance alone does not describe emissions |
| Loss and preparation | Stage-specific waste, cooking and eaten portion | Shelf life alone does not measure avoided waste |
Run a small set of relevant sensitivity cases. Vary the assumptions whose uncertainty could affect the decision, such as waste rate or storage duration. Explain why the chosen range is appropriate. Do not create dozens of arbitrary scenarios merely to locate one in which a preferred route wins.
Present the result with its scope and limits. A useful statement identifies the two routes, the functional unit, data period and important assumptions. If the work cannot support a general conclusion, report the conditional finding. That lets a buyer or menu developer understand what would need to change for a different result.
For XMG Food, a product page or supply description is not measured greenhouse-gas data. We do not infer a brand footprint or carbon advantage from the fact that we supply frozen products through partner factories. A product-specific comparison requires the relevant inventory and assessment. Our Food Knowledge articles provide background for understanding the question, while the evidence for a claim must come from the defined supply route.
Questions about produce carbon footprints
Does freezing always outweigh any reduction in waste?
No universal balance follows from preservation format alone. Both freezing and refrigeration burdens and any demonstrated loss reduction belong in the calculation. Their relative importance depends on the product, energy supply, storage and use. A specific inventory is needed to compare them.
Is local fresh produce always the lower-carbon choice?
Local distance is only one variable. Growing conditions, season, transport mode, storage, waste and preparation can change the complete comparison. A local route can be favourable in a particular case, but proximity alone does not establish the full result.
Can we compare two supplier numbers per kilogram?
Only after checking what the kilogram represents and which stages and methods are included. Delivered ingredient, purchased food and eaten food can have different denominators. Similar units printed beside incompatible boundaries do not make the results directly comparable.
What if we have no measured carbon inventory?
Describe the information needed and any clearly labelled exploratory assumptions. Avoid publishing an unverified product footprint or a general superiority claim. A transparent data gap is more useful than a precise-looking number assembled from unrelated studies.
Read more explanations in Food Knowledge.
Food Knowledge →References
Research settings and public standard descriptions provide context, not an assessed XMG product footprint.
